In this post, we unpack the data, the industry benchmarks, and the product updates that are helping leading Attractions turn more clicks into checkouts, and the product strategy focused on attraction revenue optimizations.
Q: What is a good conversion rate for ticketing websites in the attractions industry?
Conversion rates can vary across Leisure, Travel and Attractions space. According to Xola, general travel websites average a conversion rate below 1%, while dedicated tour and attraction sites — particularly those focused on direct online bookings — tend to convert between 2% and 4% in North America.
Q: How doesConnect&GO’s e-commerce conversion rate compare?
5.73% avg conversion vs 2–3% industry norm (on July 4th, 2025).
Across parks using our most recent e-commerce experience, Connect&GO is seeing conversion rates approaching 8%—nearly 2X the North American benchmark average. These are not estimates. These are real conversion rates calculated based on completed transactions per session within our e-commerce flow.
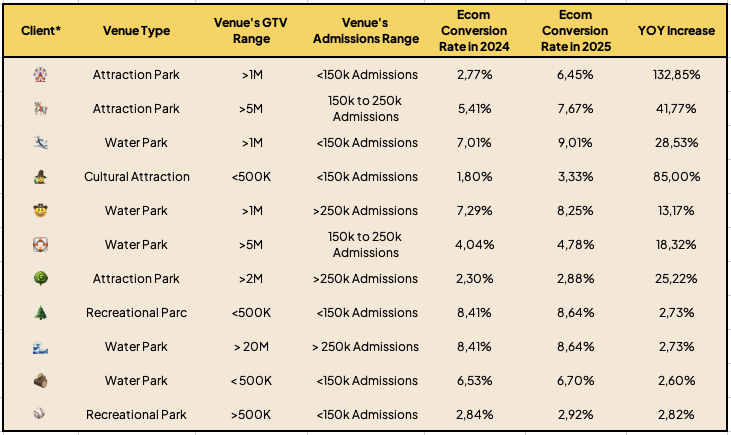
The best results are being seen across small attraction parks (admissions 150K or less), with an average YOY increase of 60%.
Water Parks have seen an average YOY increase of 13% while Attraction Parks have seen an average YOY increase of 66%.
This table offers a snapshot of e-commerce conversion improvements across a wide range of global venues using Connect&GO's Attraction Management System. It compares year-over-year performance for the same weekday (e.g., Saturday vs. Saturday), rather than the exact calendar date, to ensure fair and accurate comparison.
Q: How did we calculate these benchmarks?
The conversion rates shared in this article are based on a synthesis of publicly available benchmarks from sources like ROLLER, Xola, AudienceView, and others.
Rather than citing a single dataset, we aggreegated and summarize key patterns from multiple industry reports.
For example:
General eCommerce in North America averages ~3% conversion.
North American leisure ticketing sites tend to convert in the 2–4% range.
In Europe, that number is higher — around 4–6% — due to stronger online booking habits.
We cross-referenced these figures with online booking share (e.g. 64% in EMEA vs. 29% in the Americas) to better understand why regional performance differs.
Q: What contributes to Connect&GO's higher conversion rate?
Our results come from real product improvements—not just good luck or inflatedtraffic. In 2025, our Product team launched an enhanced e-commerce flow that included:
30% less scrolling
33% fewer clicks to purchase
Smarter ticket-to-date logic
Calendar pricing view for better planning
Optimized mobile experience
Cart timers to reduce drop-offs
These changes might seem small on their own—but together, they dramatically improve the guest experience, helping people get to “buy” faster and with less friction.
Q: Is this success purely product-driven, or is traffic quality a factor?
Connect&GO’s e-commerce conversion data is based on high-intent traffic. Guests typically land on our platform after clicking “Buy Tickets” from an operator’s main website. That means they’ve already shown purchase intent.
Q: Why does this matter for operators?
When it comes to high-traffic days, every percentage point matters. A smoother purchase journey means:
More completed purchases
Fewer abandoned carts
Faster lines at the gate (thanks to pre-booked tickets)
Less stress for staff
And, unlike legacy platforms, Connect&GO doesn’t just push software—we partnerwith your team to make real improvements that impact your bottom line.
Q: What’s the strategy behind these improvements?
It’s not luck. It’s a philosophy. As our CEO Dominic Gagnon puts it:
“Customer-led growth isn’t a buzzword for us—it’s our strategy. Our product roadmap is shaped by what real operators need to succeed in the real world.”
And, Marc-André Dubé our VP Product says:
"We focus on changes that drive business outcomes. Every UX decision we make is about reducing friction and maximizing conversion. That’s where growth really comes from.”
Q: Where can I learn more or see Connect&GO's E-commerce for Attractions in action?
See how Connect&GO helps attractions double e-commerce conversions with real product examples.
Book a personalized demo here.
A final thought on E-commerce performance and revenue optimization for attractions
IAAPA reports that attractions spend 4–8% of their gross revenue on marketing. Typically, businesses across industries will spend 50–60% on digital efforts that drive qualified traffic.
At Connect&GO, we believe e-commerce performance is the key to maximizing that investment. It improves daily operations by reducing lines and pressure on front-gate teams, and it boosts revenue by increasing average spend per transaction.
E-commerce performance isn’t just a metric for us—it’s a cornerstone of our platform’s growth engine. Our approach to attraction revenue optimization focuses not just on building a checkout flow, but on constantly analyzing and improving every digital interaction.
Because performance isn’t about features—it’s about outcomes.
And we’re here to help attractions turn every guest interaction into a growth opportunity.


.avif)
.avif)
.avif)